
The Amazon Paradox: Why “Avoid” on Paper is a “Prime Buy” in Reality
Hunting for Quality: Why Amazon Just Hit the 'Prime Buy' Zone Despite Record High CapEx Spending ⭐️⭐️⭐️


To a traditional quantitative screen, Amazon (AMZN) looks like a nightmare. With a trailing Price-to-Free Cash Flow (P/FCF) multiple of 147x, a rigid value screener would spit it out faster than a bad piece of gum. However, for a Buffett or Munger-style investor, the headline numbers are a mask.
Underneath the surface of massive capital expenditures lies a cash-generating machine with a moat so wide it has its own zip code.
The “Owner Earnings” Lens
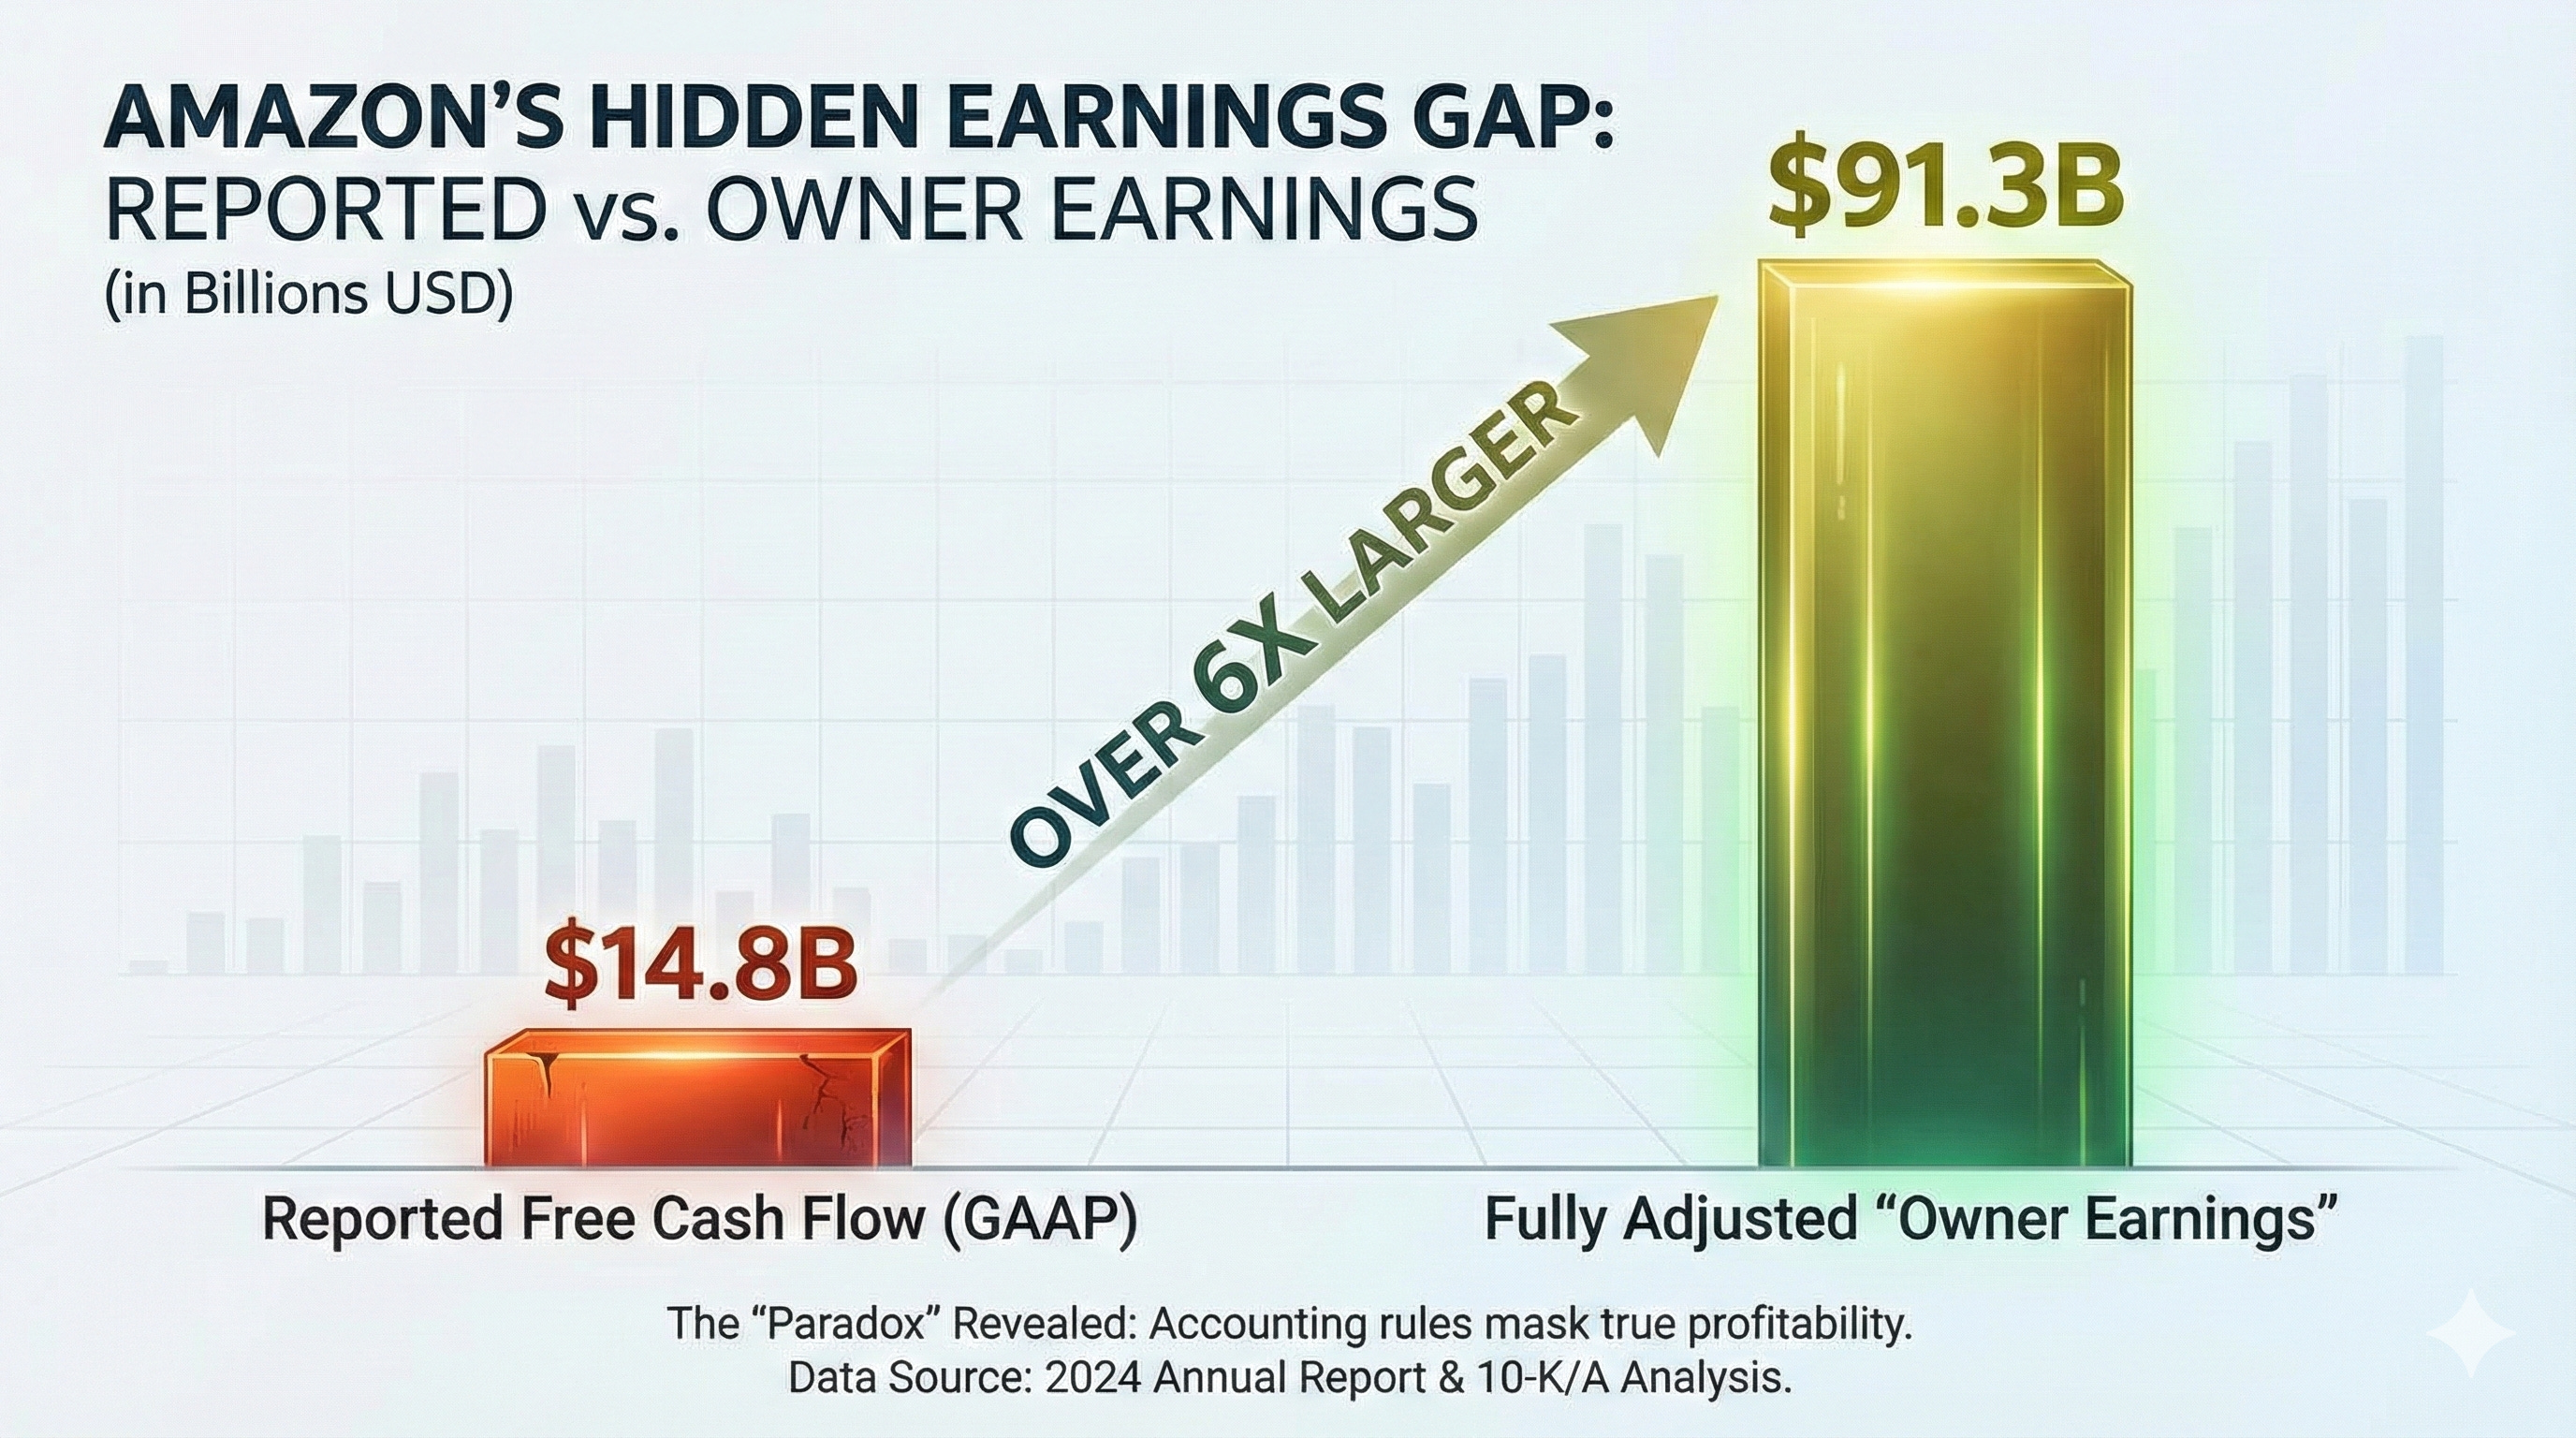
The reason Amazon fails a standard FCF screen is simple: reinvestment. The company is currently spending $115.9 billion on CapEx—primarily building out the global infrastructure for Generative AI and Project Kuiper.
When we strip away this “growth” investment and calculate Owner Earnings (Reported FCF + R&D - SBC), the picture changes entirely. Amazon’s true earning power isn’t $14.8 billion; it’s closer to $91.3 billion in Fully Adjusted FCF. This is the “hidden” cash flow that builds long-term wealth.
A Triple-Threat Moat
Amazon doesn’t just have one moat; it has three that reinforce each other:
AWS (The Fortress): High switching costs and massive scale in cloud computing.
Advertising (The Toll Bridge): High-margin revenue built on top of first-party consumer data.
Logistics (The Scale): A fulfillment network that rivals national postal services, creating an unbeatable cost advantage.
The Efficiency Flywheel: Squeezing the Sponge for Record Margins
In the world of retail and technology, there is a common myth that as a company becomes a behemoth, it inevitably becomes bloated and slow. Amazon is currently dismantling that myth. To understand the thesis for AMZN, you have to look at the Efficiency Flywheel, the steady, relentless climb of the company’s operating margins.
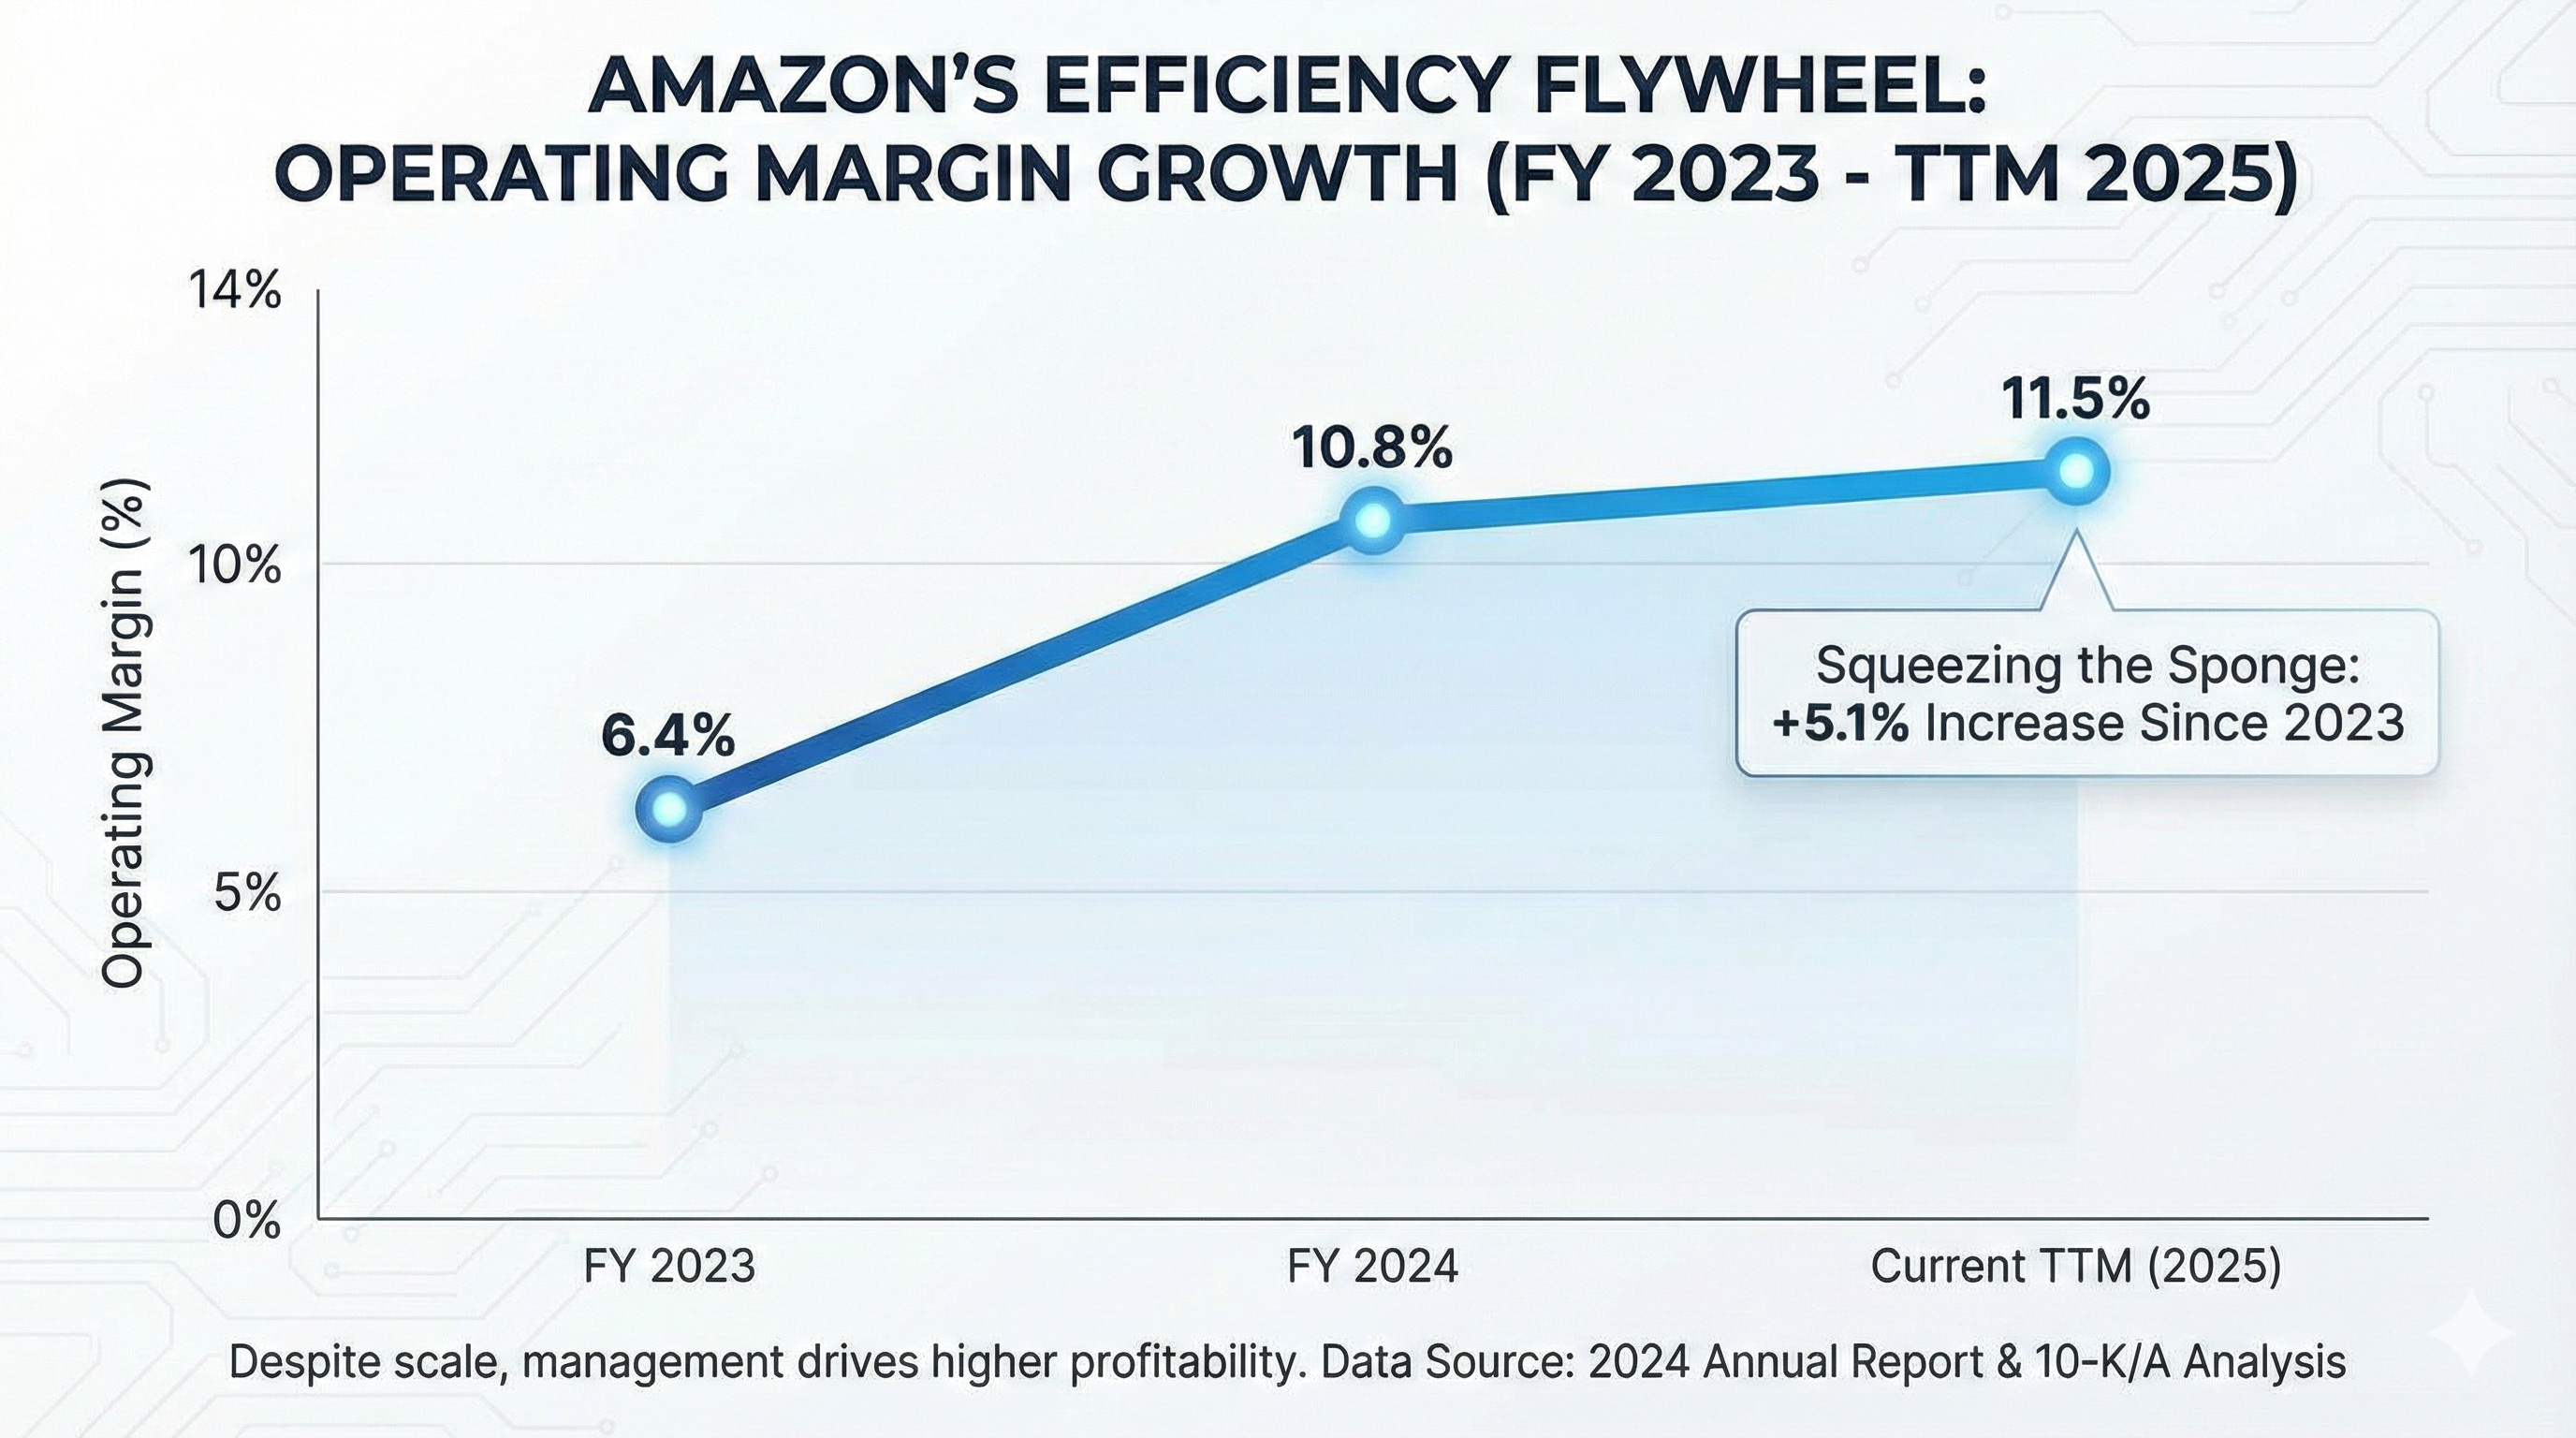
In 2023, Amazon posted an operating margin of 6.4%. While respectable for a retailer, it didn’t scream “tech giant.” Fast forward to 2024, and that number jumped to 10.8%. Today, the trailing twelve-month (TTM) data shows a further climb to 11.5%.
Why it matters: This upward trend is what we call “squeezing the sponge.” Even as Amazon grows its massive revenue base, it is becoming more profitable on every dollar earned.
This isn’t happening by accident. It is the result of three specific management moves:
Regionalization: Shifting from a national fulfillment network to eight distinct regions, which cut down on travel distance and shipping costs.
AWS Scale: The cloud business continues to benefit from massive economies of scale, maintaining high margins even as competition heats up.
The Ad Engine: Amazon’s advertising business—essentially “high-margin digital real estate”—is growing faster than the core retail business, pulling the overall margin profile higher.
For investors, this graph is the ultimate signal of operational excellence. It shows a management team that isn’t just focused on getting bigger, but on getting better. As the flywheel spins faster, the gap between Amazon and its competitors doesn’t just stay wide—it becomes an unbridgeable chasm.
The AI Arms Race: Mapping the $115 Billion Fortress
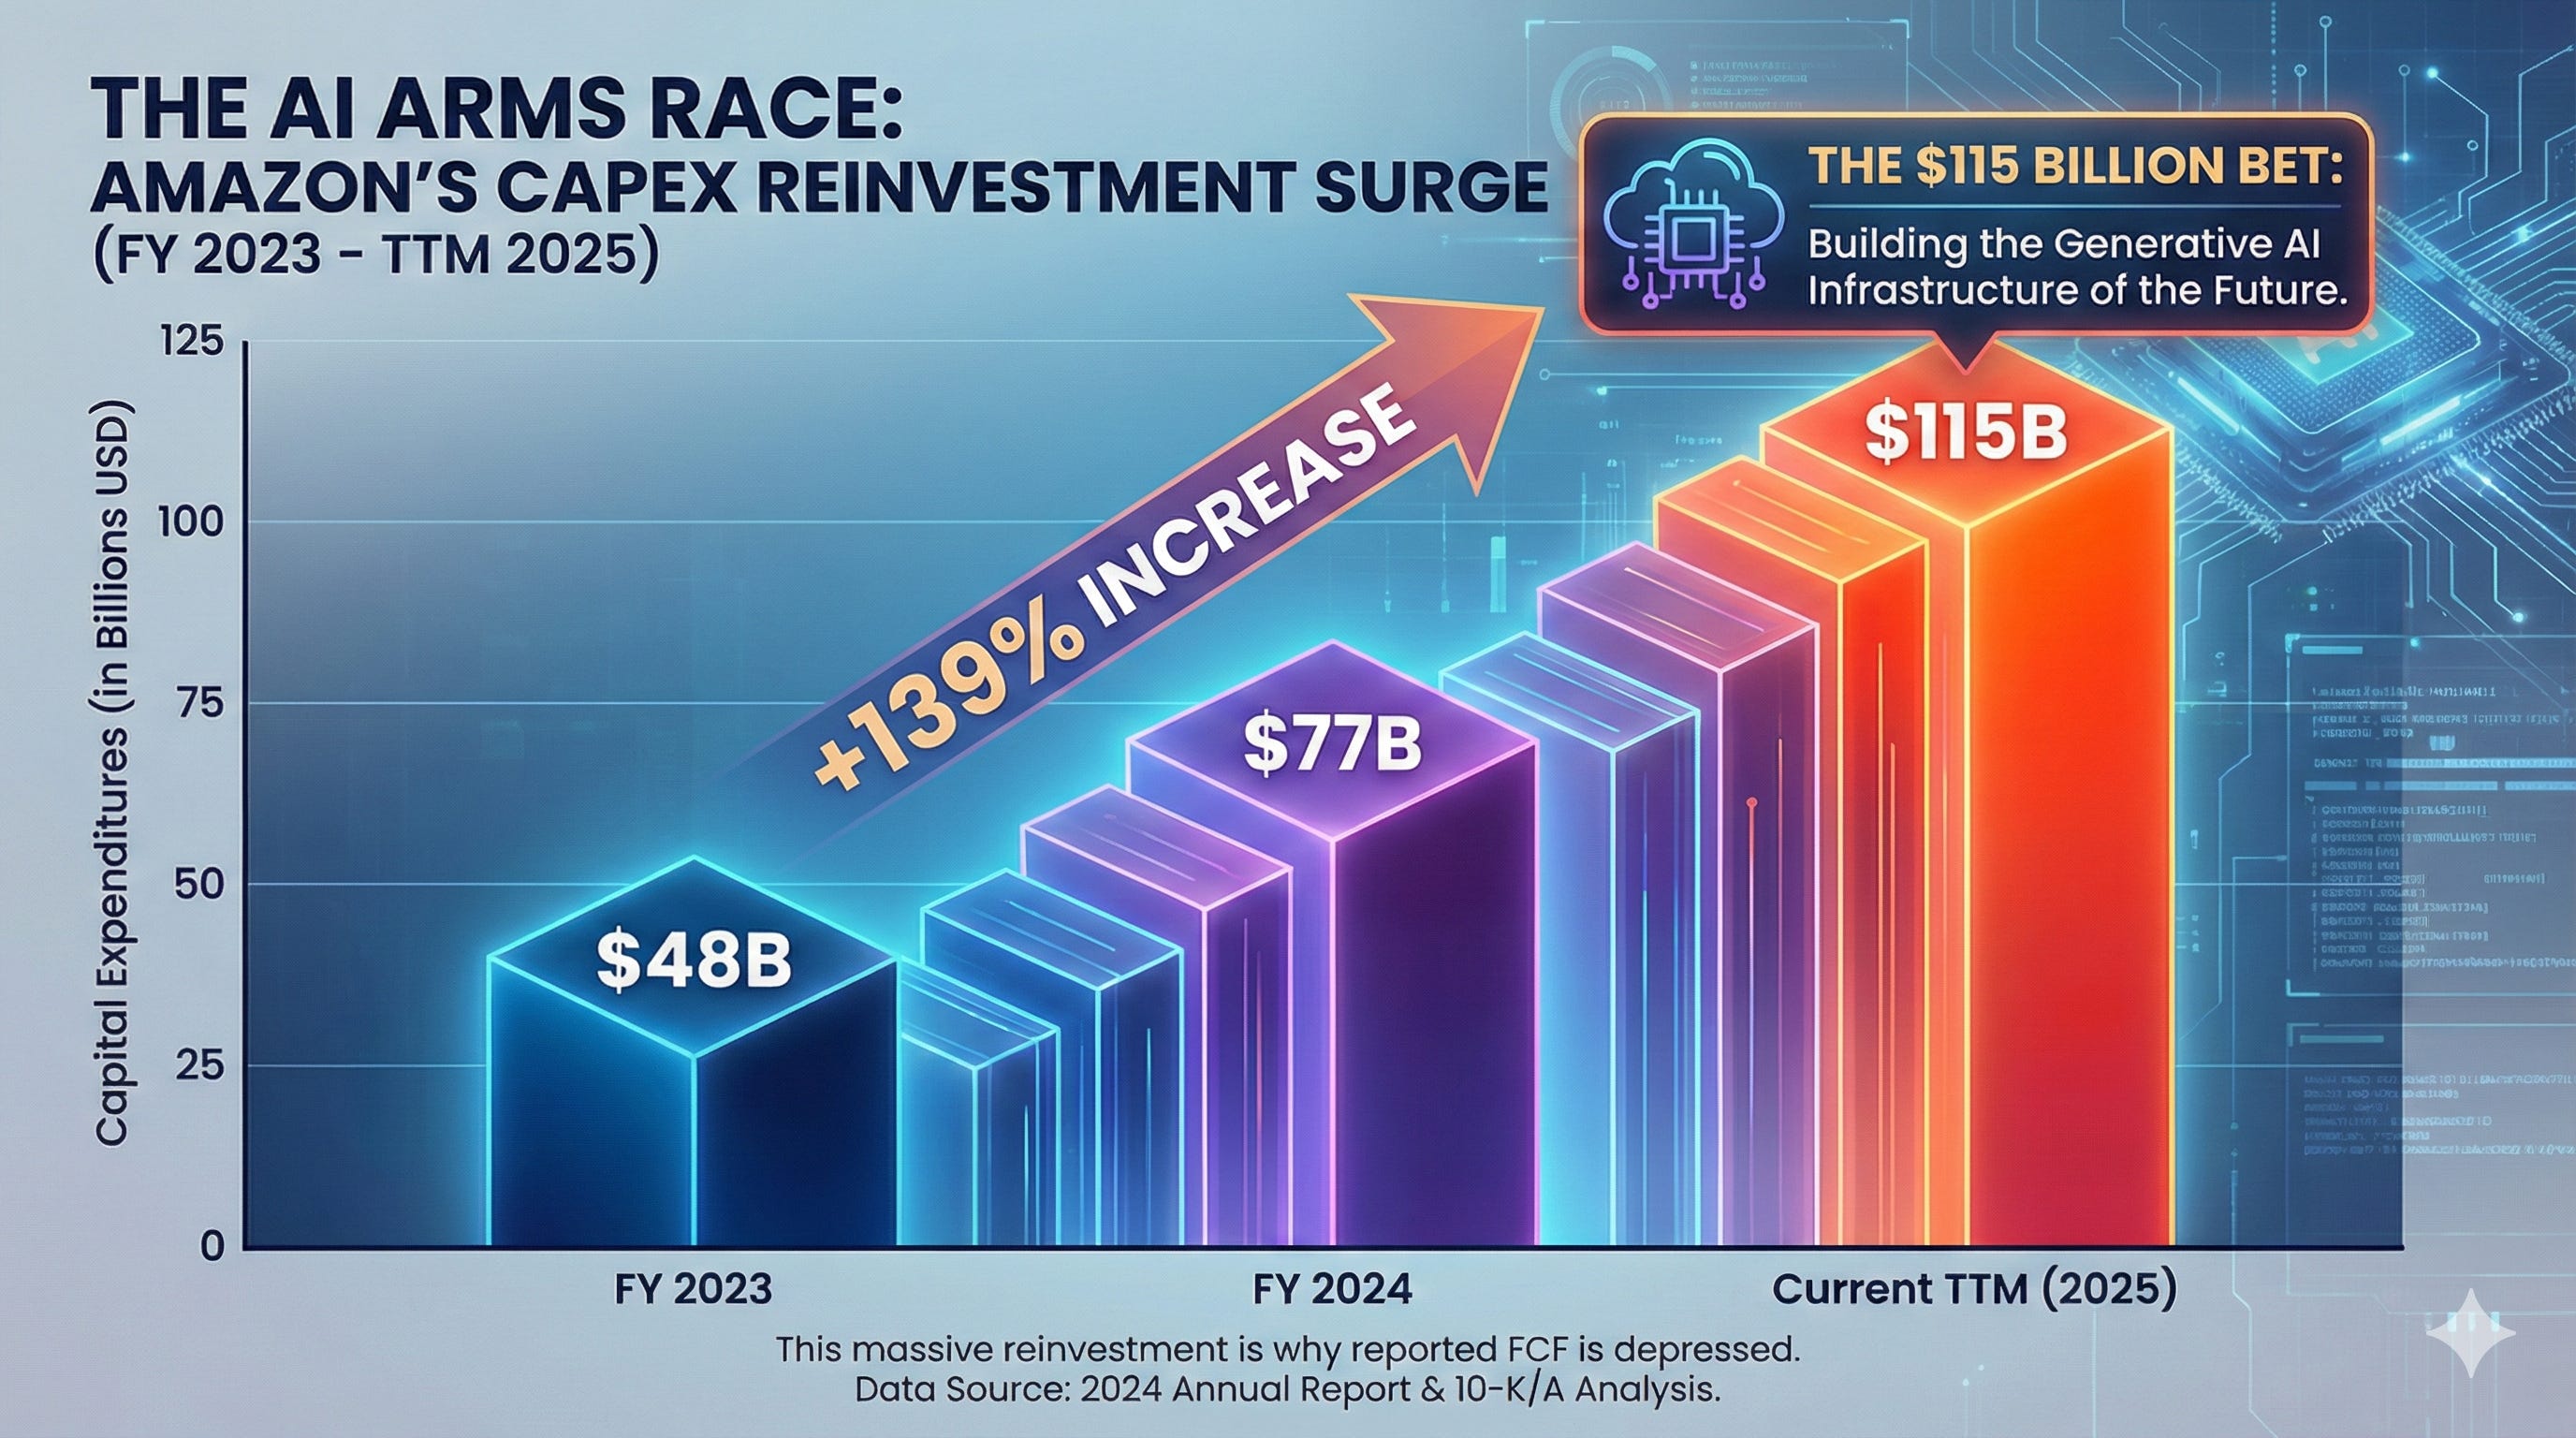
If you look at Amazon’s reported cash flow and feel a sense of dread, you are looking at the bill but missing the asset. To understand why reported Free Cash Flow has dipped, you have to look at the “staircase” of reinvestment.
Between 2023 and today, Amazon’s Capital Expenditure (CapEx) hasn’t just grown; it has entered a vertical climb. We have moved from an already massive $48 billion in 2023 to a staggering $115 billion in the latest twelve-month period.
This isn’t just “spending”—it is a strategic bet on the future of global commerce and compute. This $115 billion goes toward the silicon, the data centers, and the energy required to power the Generative AI revolution. But there is a physical dimension to this moat that most analysts overlook: The Robotic Army.
Amazon currently has more private mobile robots deployed than any other company on Earth. For years, these robots have provided a “dumb” efficiency—moving heavy pallets from point A to point B. Now, Amazon is injecting Generative AI into the brains of these machines.
The result? Robots that can perceive, learn, and adapt to complex environments in real-time. Because the infrastructure is already being built, adding AI to this existing robotic fleet has nothing but margin upside. Every second shaved off a package’s journey and every percentage point of increased warehouse density translates directly into “Owner Earnings” once the initial CapEx cycle cools.
For investors, this staircase represents the construction of a technological fortress that competitors simply cannot afford to siege. Amazon is sacrificing today’s reported profits to ensure they own the infrastructure of tomorrow.
The Management Scorecard
CEO Andy Jassy has pivoted the ship toward efficiency. Operating margins have expanded from 6.4% to 11.5% in just two years. More importantly, executive compensation is tied to Long-Term Free Cash Flow per share, aligning management’s pockets directly with yours.
💰 Final Verdict: The 3 Levels of Margin of Safety
Using our Intrinsic Value (IV) model based on $91.3B in Owner Earnings, here is how to read the current price levels.
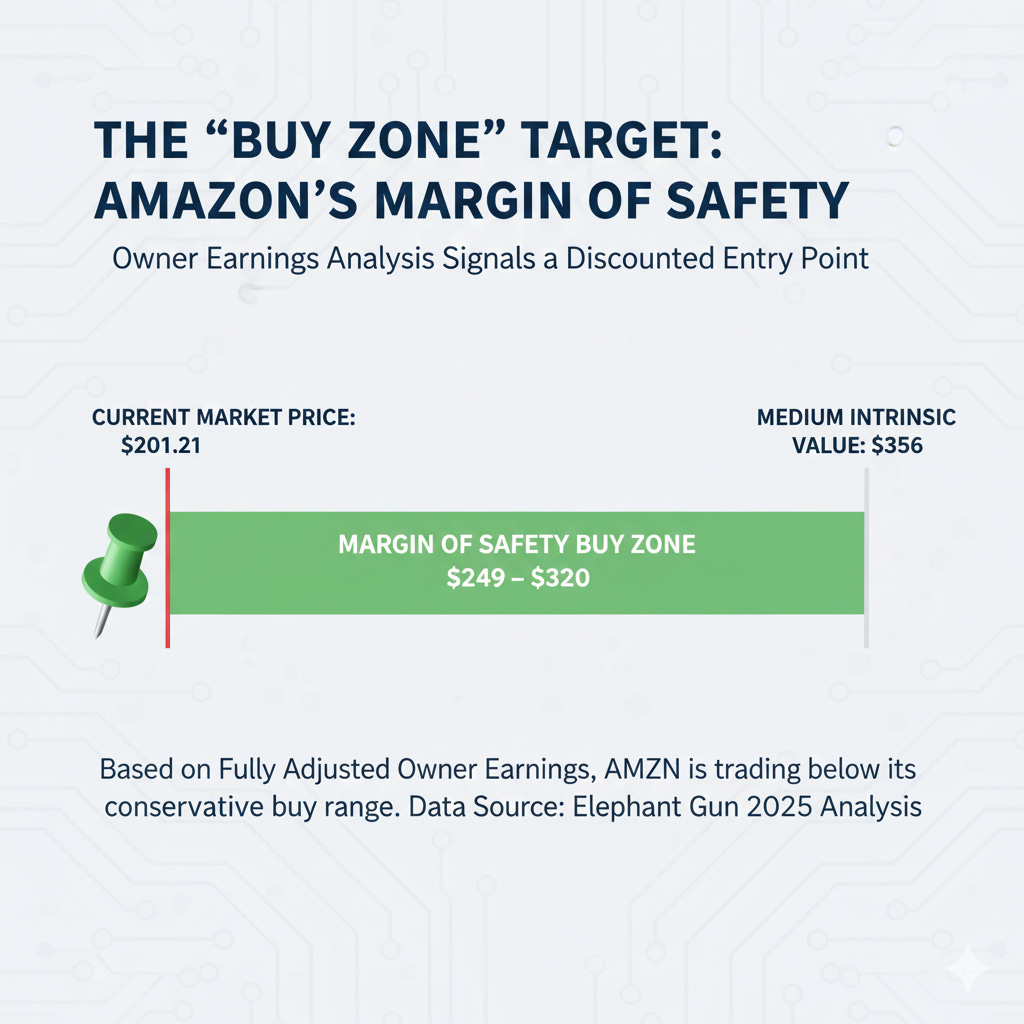
⭐⭐⭐ We are in the Prime Buy Zone (Below $320.56)
The Math: This represents a price at or below 90% of our Medium Intrinsic Value ($356.18).
Why it’s a “Prime Buy”: At today’s share price you are buying the business for significantly less than its “Owner Earnings” value. You are essentially getting the retail business for free and paying a discount for the cloud and advertising segments. This provides a massive Margin of Safety against regulatory risks or temporary economic downturns.
Verdict: BUY. Despite a “mechanical” failure on the FCF Gate Check due to extreme AI infrastructure spending, the Owner Earnings valuation shows Amazon is trading at a steep discount to its true intrinsic worth.